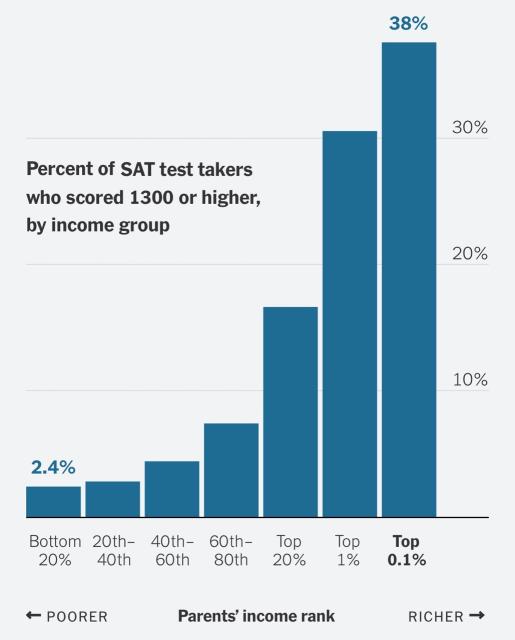
It turns out that students’ test scores rise with their parents’ incomes. 🤔
nytimes.com/interactive/2023/1… #GiftArticle
New SAT Data Highlights the Deep Inequality at the Heart of American Education
The differences in how rich and poor children are educated start very early.Claire Cain Miller (The New York Times)

Dr Suzanne she/her
in reply to Sheril Kirshenbaum • • •Terri K O 🍁
in reply to Sheril Kirshenbaum • • •Sean
in reply to Sheril Kirshenbaum • • •I worked part time as an SAT tutor and it was very a course on how to game the test.
"Here's the kind of essay that scores well"
"The answers for reading comprehension usually follow this pattern"
"Wrong answers are minus points while non answers give no points. Here's when to guess and when to leave an answer blank"
So those who could afford the pricey courses got to learn the meta of the test, leaving those without at a disadvantage. Of course they navigated the woods better, they got a map before hand, and thus we've lost the whole point of a "standardized" test
Kalshann
in reply to Sheril Kirshenbaum • • •I wonder how many of the lower 40% had part time jobs or did full home care for siblings or family? How many were never given instruction on test materials because the teachers had to deal with oversized classes or whatever.
Also, rightfully everyone is pointing to how the system is stacked but it's good to remember it's not the kid's fault. Affluent or poor. It's the system, the parents. Corruption in the political and academic circles. The kids just got pushed into whatever situation
Wild Eyed Boy From Freecloud
in reply to Sheril Kirshenbaum • • •Tom Bellin
in reply to Sheril Kirshenbaum • • •Thank you for sharing this. Education as a public and societal good has always been the rhetoric, but we have to acknowledge that the system has always had, at its core, the goal of preserving the status of elites.
Once again, what's good for the elite is bad for everyone else.
The problem here isn't so much that different income levels have different outcomes. It's that the disparity in income is so great that it distorts *everything*.
#eattherich
Roy Brander🍁
in reply to Sheril Kirshenbaum • • •You've missed the main message of that graph,which was the ABSOLUTE numbers.
It isn't that only 2.6% of poor kids who were tested got >1300, it's that only 2.6% who got >1300 were poor.
A combination of SLIGHTLY lower scores, and mostly that poor kids don't take the test because they have no prayer of college.
Google phrase "sat average score vs income" to see that average score below $20k income is 970; above $200k, 1230. Significant, but not as dramatic as the nyt graph above.
Son Light Life
in reply to Sheril Kirshenbaum • • •Fessup
in reply to Sheril Kirshenbaum • • •