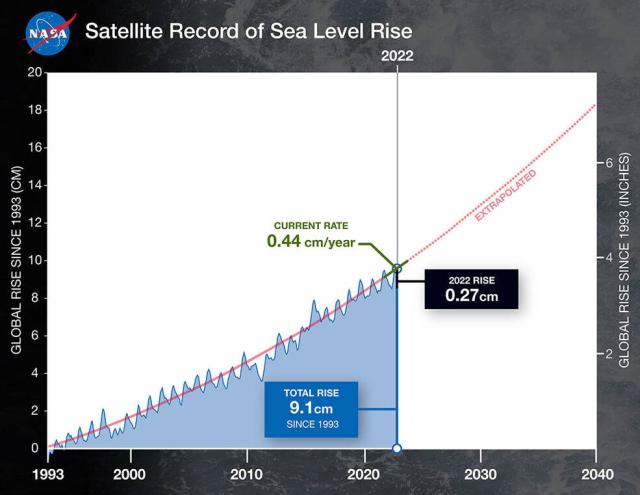
This graph shows data from five successive satellites, beginning in 1993. The solid red line shows the trajectory of rise from 1993 to 2022, illustrating that the rate of rise has more than doubled. By 2040, sea levels could be 3.66 inches (9.3 cm) higher than today.
#NASAEarth
#NASAEarth
