Another #rstats post - what are your favourite examples when teaching students to think critically about data/figures and interpretations?
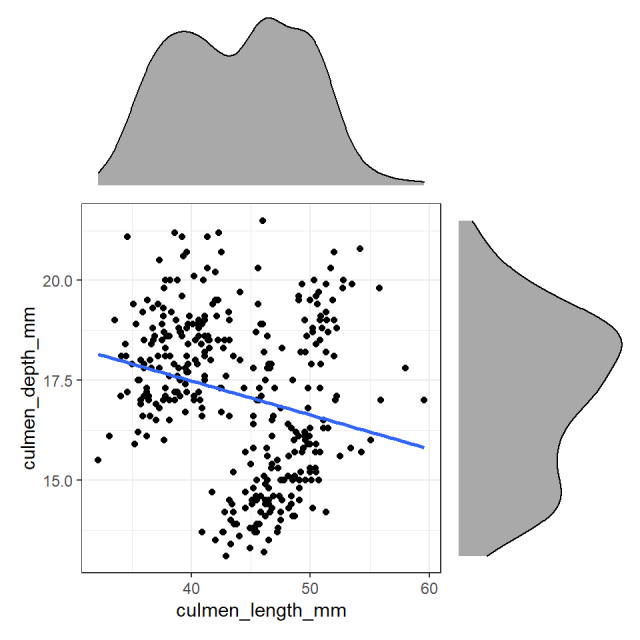
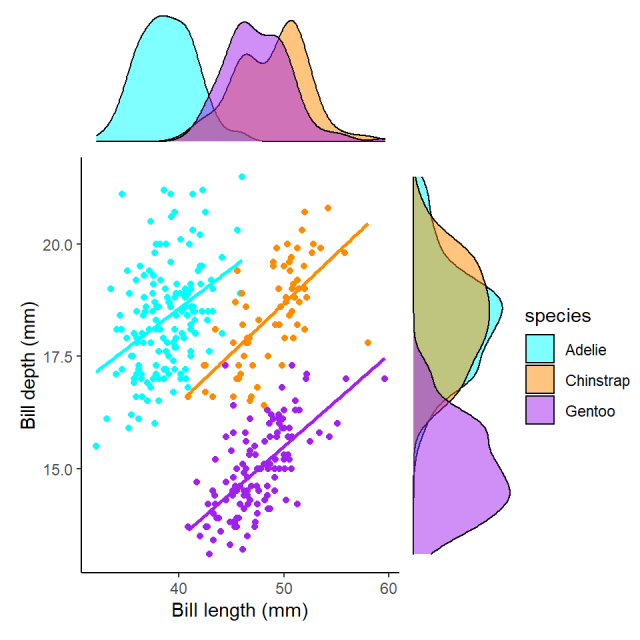
For example, Simpson's Paradox and the importance of considering important subpopulations - is brilliantly displayed in the Palmer Penguins dataset.
For example, Simpson's Paradox and the importance of considering important subpopulations - is brilliantly displayed in the Palmer Penguins dataset.


Ben Longdon
in reply to PhilipLeftwich • • •