Search
Items tagged with: nasaearth

#NASAEarth

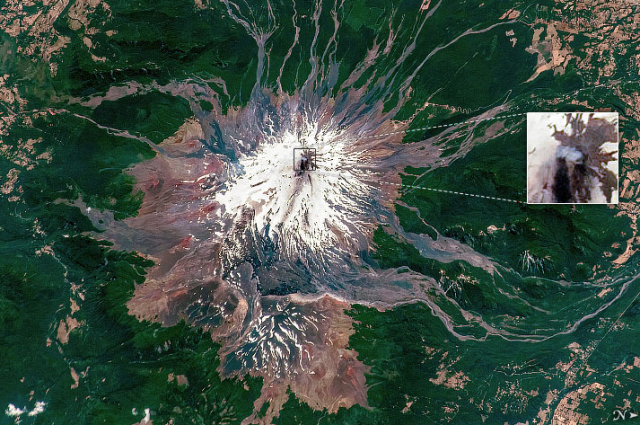
One of Chile’s most active volcanoes, Villarrica, is having a minor eruption. 🌋
Plumes of steam and volcanic gases (magnified in the inset image) can be seen in this @Space_Station photo from Jan. 17, 2023. go.nasa.gov/3HI8Leb
#NASAEarth
Chile’s Villarrica Sputters
An astronaut on the International Space Station captured this photograph of minor explosions from one of Chile’s most active volcanoes.go.nasa.gov
Low-level Strombolian activity – small, short eruptions – is common at Villarrica. As of Jan. 27, the alert level was still elevated at yellow (the second on a four-color scale).
Read the full story ⬇️ go.nasa.gov/3HI8Leb
#NASAEarth
Chile’s Villarrica Sputters
An astronaut on the International Space Station captured this photograph of minor explosions from one of Chile’s most active volcanoes.go.nasa.gov
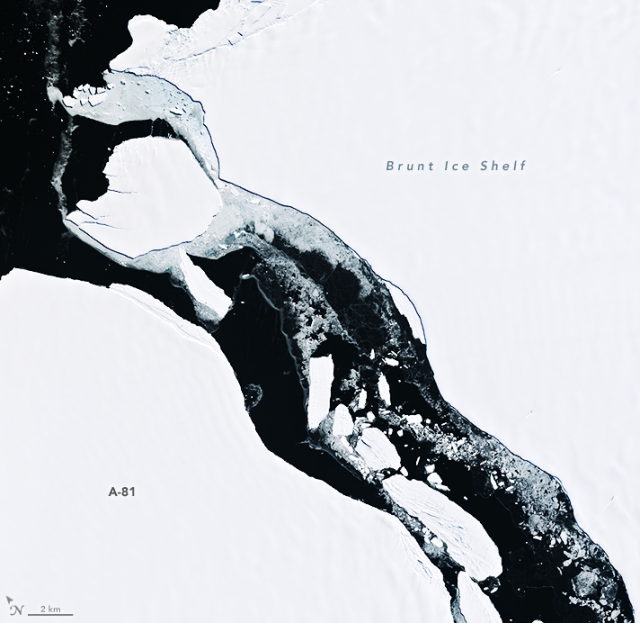
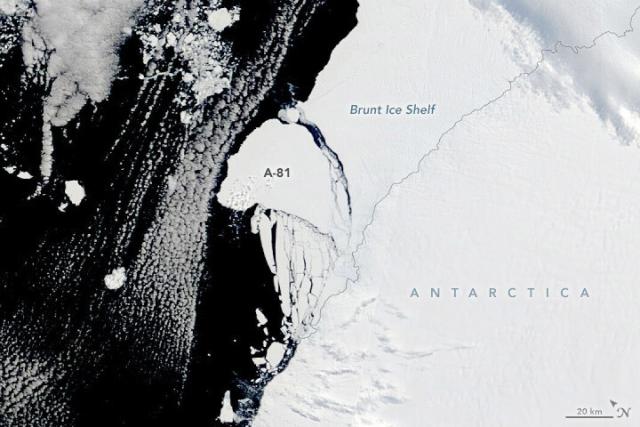
Update on berg A-81🧊
This #Landsat image from Jan. 25 shows the A-81 berg on the left and the new front of the Brunt Ice Shelf on the right.
According to a @NASAGoddard glaciologist, satellite images show the front has retreated 20 km since 1973. go.nasa.gov/1333
#NASAEarth
👩🚀🌎: go.nasa.gov/3JeaLfv
#NASAEarth

Rio Grande, Meet the Gulf of Mexico
Colorful waterways and wetlands are visible along the river that defines a portion of the U.S.-Mexico border.go.nasa.gov
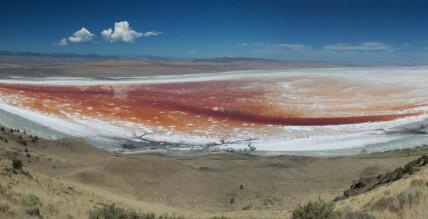
Lake Albert in southern Oregon is drying up due to years of water withdrawals and dry weather.
The lake is also becoming too salty to support the flies and brine shrimp that serve as a food source for migrating birds.
Full story: go.nasa.gov/3kPwsIE
#NASAEarth
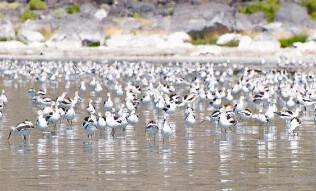
Shrinking Lake Abert
As the lake in southern Oregon dries up, the remaining water is becoming too salty to support key food sources for birds.go.nasa.gov
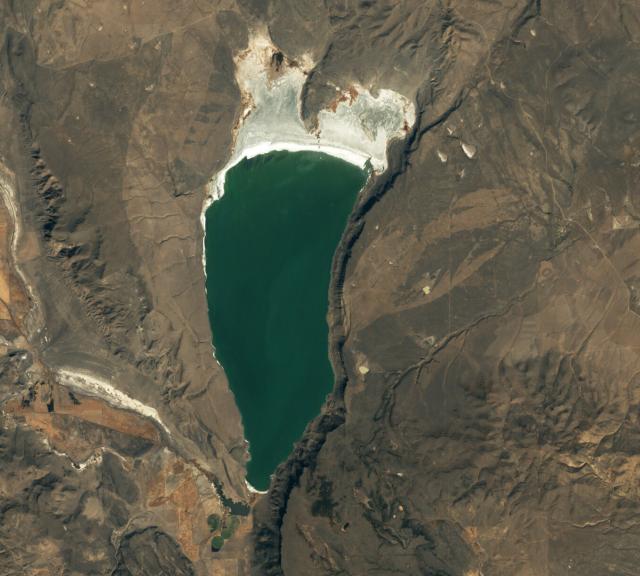
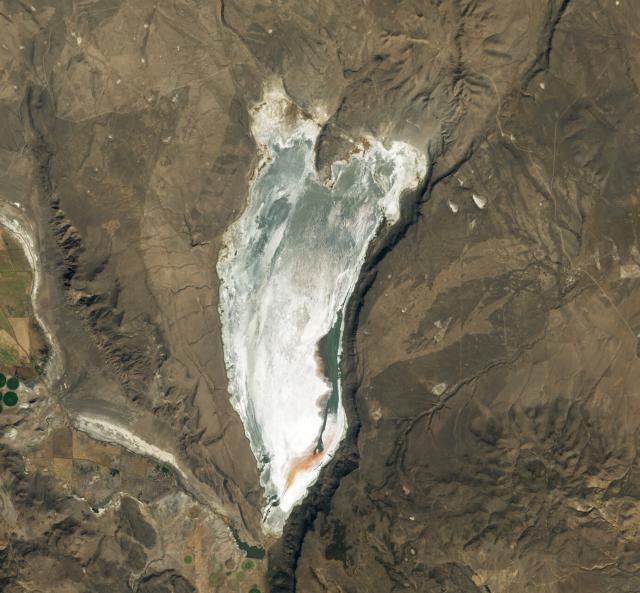
To understand why the lake is drying up, scientists analyzed two decades of @nasa’s Terra satellite data.
They found that between 2001 and 2021, fewer days of snow cover and higher surface temperatures led to more evaporation over Lake Albert. go.nasa.gov/3kPwsIE
#NASAEarth
Shrinking Lake Abert
As the lake in southern Oregon dries up, the remaining water is becoming too salty to support key food sources for birds.go.nasa.gov
Did COVID affect climate change? Climate change-causing greenhouse gases only decreased a little, so these gases continued to build in our atmosphere.
@NASAClimate scientist Leslie Ott explains go.nasa.gov/3D1MoO5
#NASAEarth
Emission Reductions From Pandemic Had Unexpected Effects on Atmosphere
Earth’s atmosphere reacted in surprising ways to the lowering of emissions during the pandemic, showing how closely climate warming and air pollution are linked.Climate Change: Vital Signs of the Planet
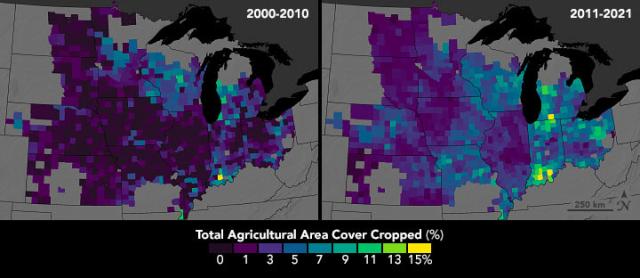
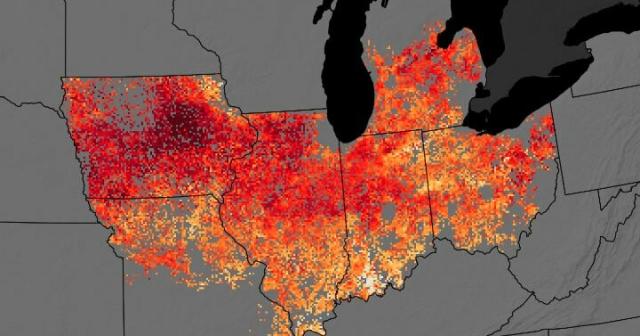
Planting cover crops – those planted between growing seasons – decreases the total harvest of corn and soybeans in the U.S. Midwest, a new #NASAHarvest study found.
Full story: go.nasa.gov/3XLwUGj 🌽
#NASAEarth
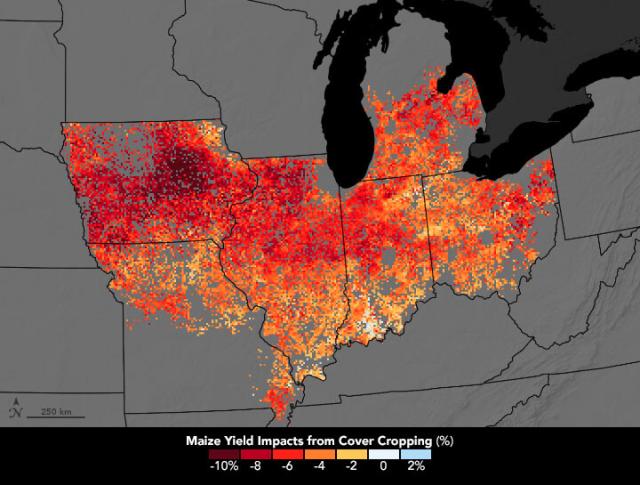
Midwest Farmers Using Cover Crops Take Small Yield Hit
Although cover crops have significant environmental benefits, researchers found that they hinder yields on corn and soybean fields.go.nasa.gov
#NASAEarth

#NASAEarth
Midwest Farmers Using Cover Crops Take Small Yield Hit
Although cover crops have significant environmental benefits, researchers found that they hinder yields on corn and soybean fields.go.nasa.gov
Ready for a puzzler?
This satellite image shows a place on our planet.
Tell us where this is, what we’re looking at, and why it’s interesting. (And, no, it’s not a close up of powdered donuts.)
🧩: go.nasa.gov/4077EvS
#NASAEarth
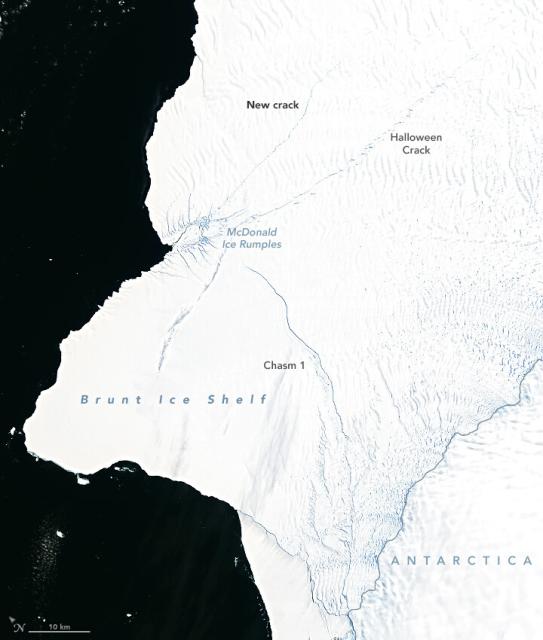
In Antarctica, a long-watched rift in the Brunt Ice Shelf produced an iceberg about twice the size of New York City: Iceberg-A81. 🧊
The iceberg, with an area of 1550 square kilometers (about 600 square miles), was captured by @nasa’s Terra satellite.

Antarctica’s Brunt Ice Shelf Finally Breaks
A long-watched rift has spawned an iceberg about twice the size of New York City.go.nasa.gov

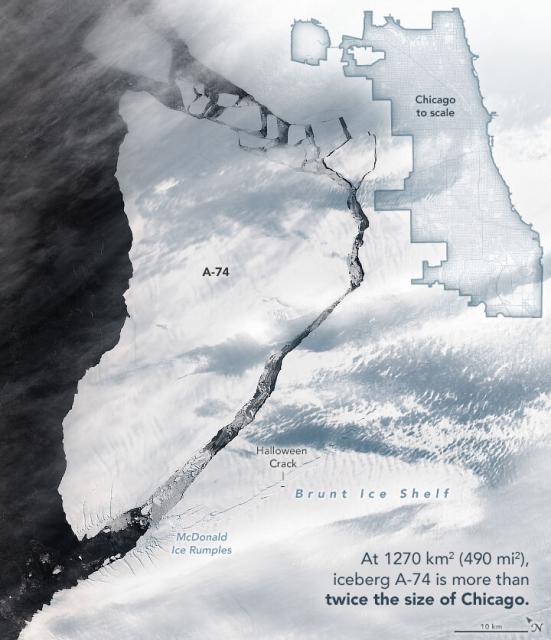
#ICYMI: In February 2021, the Brunt Ice Shelf calved A-74, an iceberg that spanned about 1270 square kilometers (490 square miles), or about twice the size of Chicago.

Breakup at Brunt
A large iceberg finally split from the Antarctic ice shelf, but another piece stubbornly hangs on.go.nasa.gov
In Antarctica, a long-watched rift in the Brunt Ice Shelf produced an iceberg about twice the size of New York: Iceberg-A81. 🧊
The iceberg, with an area of 1550 square kilometers (about 600 square miles), was captured by @nasa’s Terra satellite.
Antarctica’s Brunt Ice Shelf Finally Breaks
A long-watched rift has spawned an iceberg about twice the size of New York City.go.nasa.gov
#ICYMI: In February 2021, the Brunt Ice Shelf calved A-74, an iceberg that spanned about 1270 square kilometers (490 square miles), or about twice the size of Chicago.
Antarctica’s Brunt Ice Shelf Finally Breaks
A long-watched rift has spawned an iceberg about twice the size of New York City.go.nasa.gov
⤵️ We'll be chatting live with Christine tomorrow at 12 p.m. PT / 3 p.m. ET on Instagram: instagram.com/nasaearth
[Video embedded in original tweet]
#NASAEarth
After several weeks of heavy rainfall in northeastern Australia, the floodwater has moved south.
The surge of water is visible in this false-color satellite image from January 22 (right) as compared to before the flooding (left).
Full story: go.nasa.gov/3XPcKe0 🌧
#NASAEarth
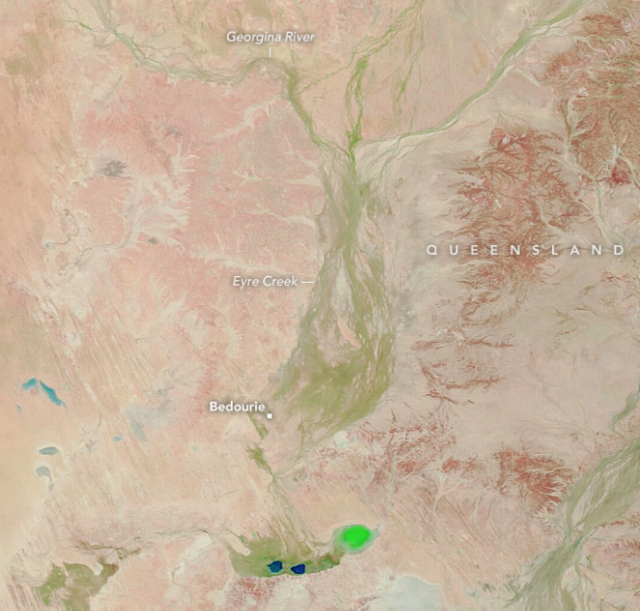
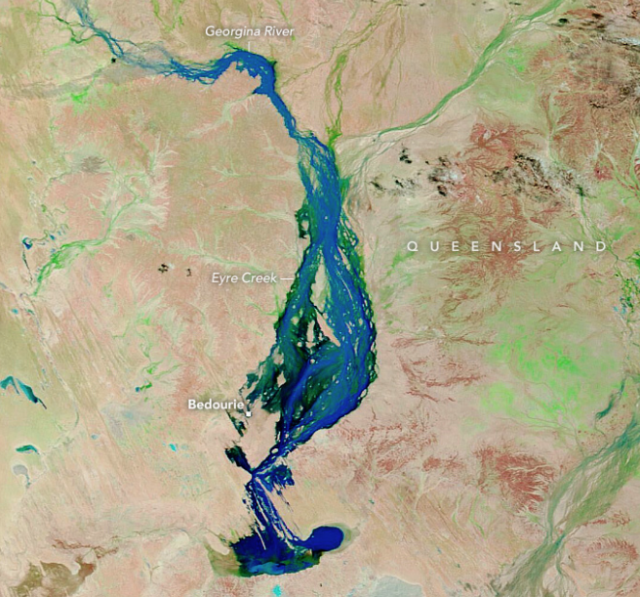
Floodwater Reaches Australia’s Channel Country
After several weeks of heavy rainfall in northern Queensland, the water has worked its way south.go.nasa.gov
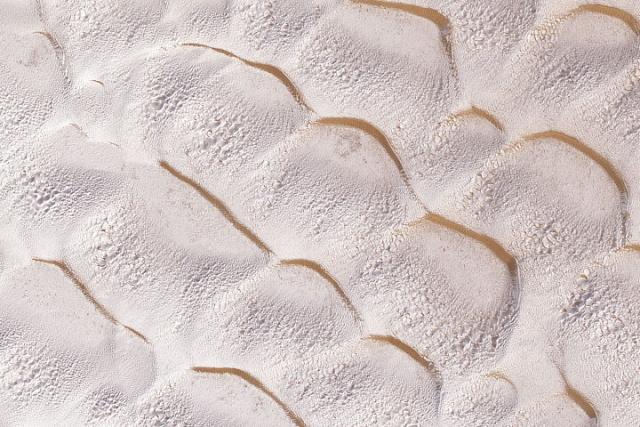
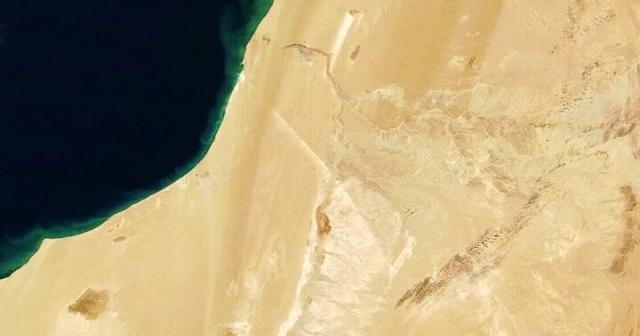
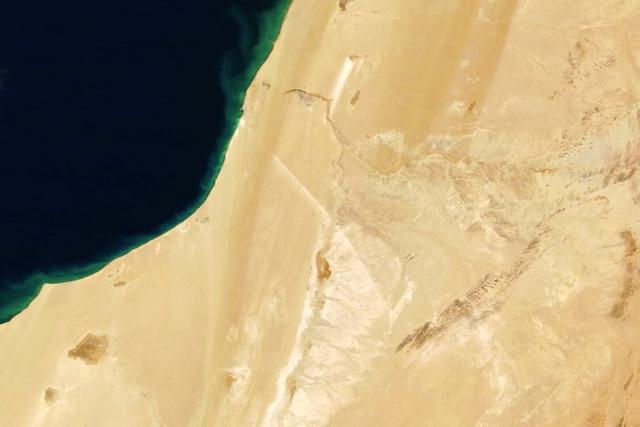
White dust from chalky phosphate rock can be seen blowing from the belt structure in the image from @nasa’s Terra satellite. The white dust helps the belt stand out from the brown desert landscape.
More info: go.nasa.gov/3XBQHrD
#NASAEarth

World’s Longest Conveyor Belt System
The conveyor belt helps transport an essential agricultural fertilizer from the remote reaches of Western Sahara to farmlands across the world.go.nasa.gov
The line in the sand is the world’s longest conveyor belt system, stretching 61 miles across the Sahara Desert! 🤯
The conveyor belt transports phosphate rock from the Bou Craa mine to the coastal town of El Marsa. go.nasa.gov/3XBQHrD
#NASAEarth
World’s Longest Conveyor Belt System
The conveyor belt helps transport an essential agricultural fertilizer from the remote reaches of Western Sahara to farmlands across the world.go.nasa.gov
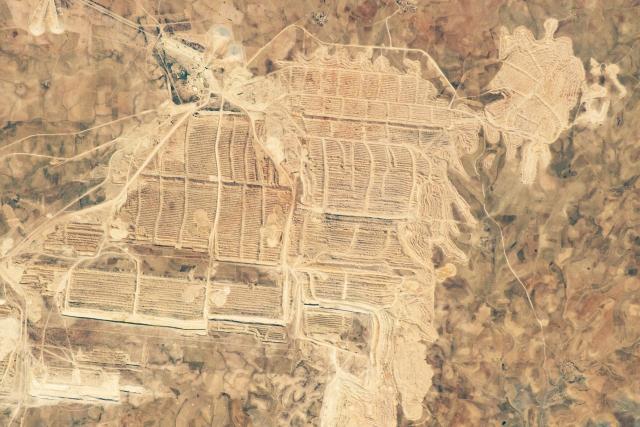
See that line in the sand? What do you think it is? 🤔
We’ll give you a hint to keep in “mine” – this satellite image shows the western edge of the Sahara Desert.
#NASAEarth

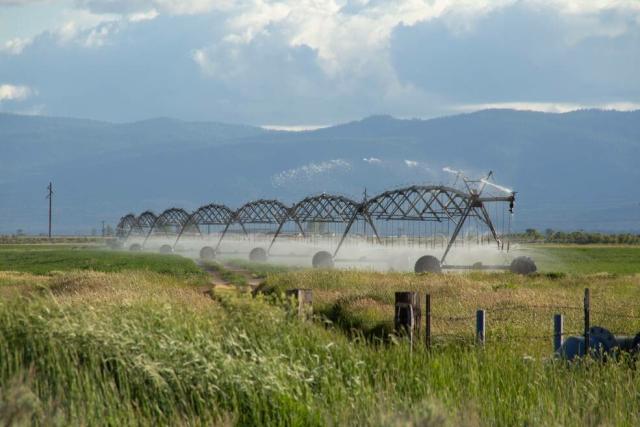
💧New finding: Water percolating underground from the Sierra Nevada mountains into California’s Central Valley provides 10% of all water entering the valley, measured using NASA satellite data and GPS.
The region relies heavily on underground water for crop irrigation.
#NASAEarth
#NASAEarth
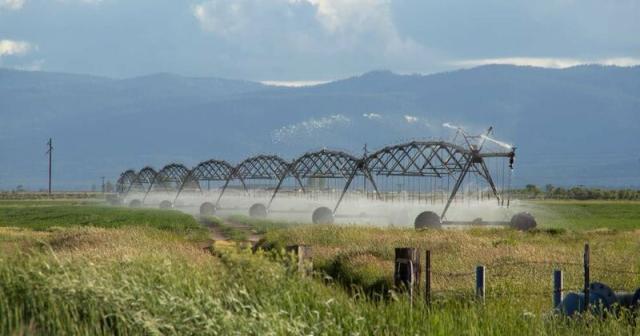
NASA Measures Underground Water Flowing From Sierra to Central Valley
This source accounts for about 10% of all the water that enters this highly productive farmland, including rivers and rain.Naomi Hartono (NASA)
Patches of suspended material sporadically appear in the Bahamas, and scientists don’t know why. 🧐
Now, one team has compiled a detailed record of these events by analyzing thousands of images from @nasa’s Aqua satellite. go.nasa.gov/3kCxnMr
#NASAEarth
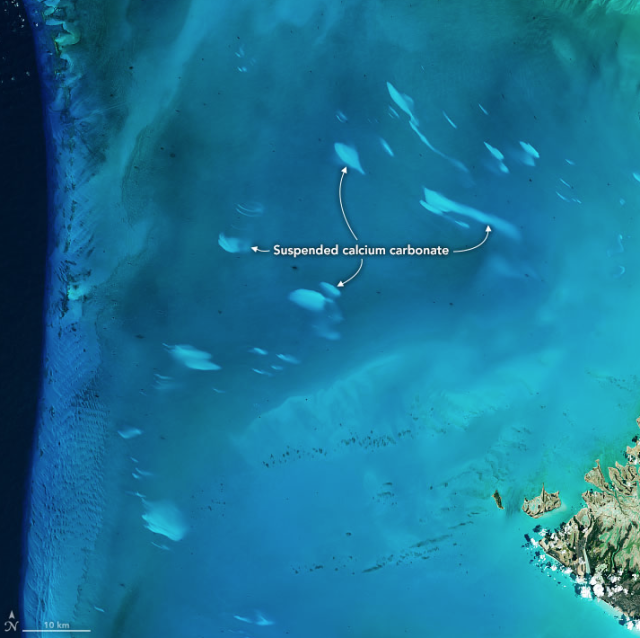
Mysteries Remain About Bahama Whiting Events
Researchers used satellite imagery to reveal where and when the discolored patches of water appeared between 2003 and 2020 and found a puzzling temporary increase in events in some areas.go.nasa.gov
Looking for NASA Earth science data? 🌏🔍
Search our new science discovery engine. Discovery awaits!✨
sciencediscoveryengine.nasa.go…
#NASAEarth
NASA is committed to open science – making all of our data, tools, and resources free and accessible to everyone.
Learn more: science.nasa.gov/open-science-…
#NASAEarth
Open-Source Science Initiative | Science Mission Directorate
NASA is making a long-term commitment to building an inclusive open science community over the next decade.science.nasa.gov
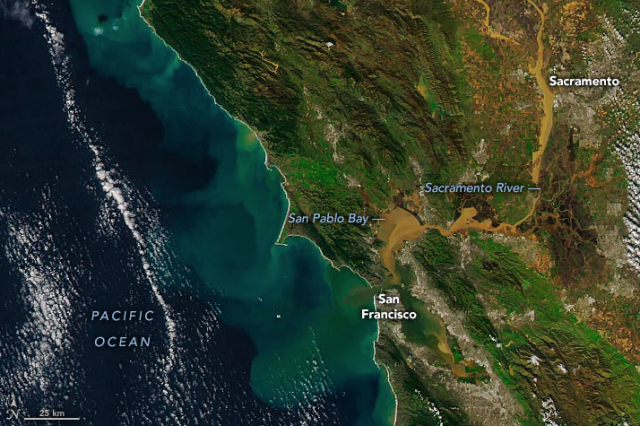
After a series of atmospheric rivers, sediment billowed into the Pacific Ocean along the California coastline.
These satellite images show swirls of sediment on Jan. 17 (right) compared to more typical conditions on Jan. 23 (left). go.nasa.gov/3QYCHFV
#NASAEarth
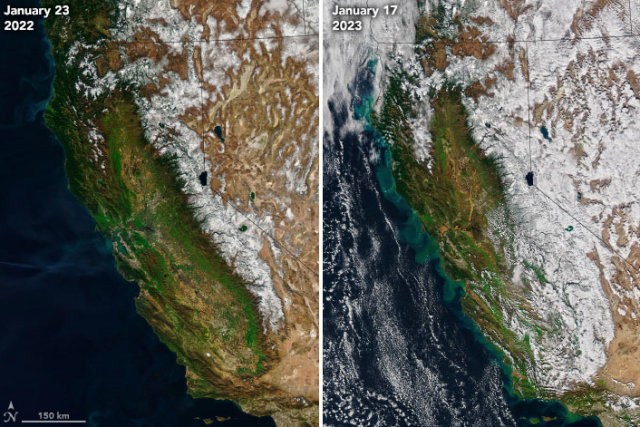
An Outpouring of Color
Following a siege of atmospheric rivers, sediment billowed into the Pacific Ocean along the California coastline.go.nasa.gov
#NASAEarth
This satellite image shows a long cloud formation, called a cavum, spanning part of southeastern France.
Seen from below, cavum can look like a large circle hole-punched in the clouds. go.nasa.gov/3QQf2Yn
#NASAEarth
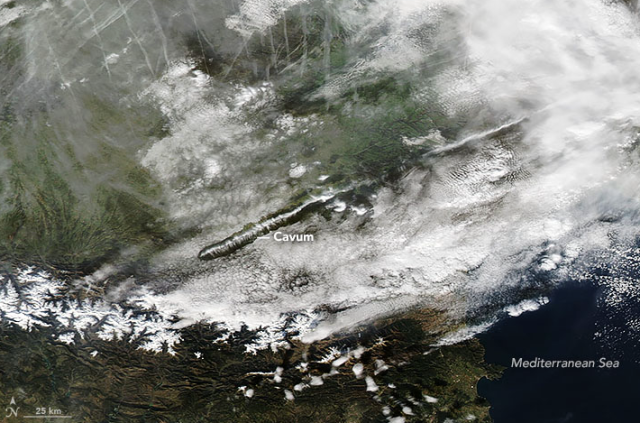
When Clouds Cave
When airplanes pass through clouds with supercooled water droplets, they can leave distinctive holes in their wake.go.nasa.gov
Earth in blues and browns 💙🤎
Nevada’s Clayton Valley, the site of the only active lithium mine in the United States, is shown in this #Landsat 9 image captured on December 8, 2022.
⛏️: go.nasa.gov/3ke4eXx
#NASAEarth
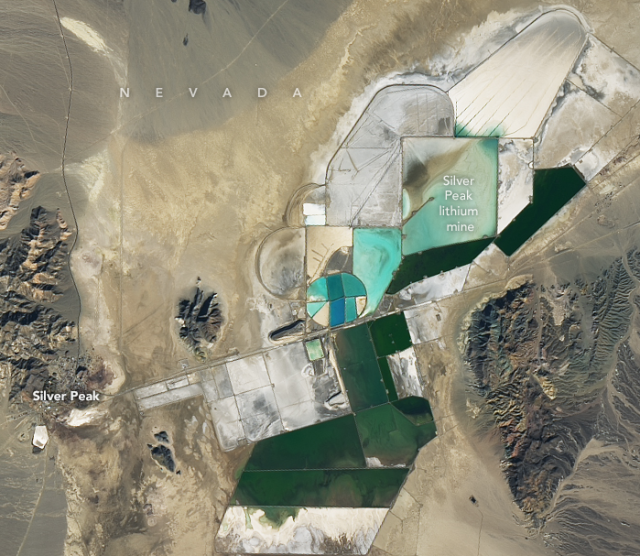
Racing to Mine Lithium
One way of harvesting the valuable metal involves the use of evaporation ponds that concentrate the substance into lithium-rich brines.go.nasa.gov
This astronaut photograph, taken from the @Space_Station, illustrates the geology of the Zagros Mountains in southern Iran, along the Persian Gulf coast.
This view shows two geological features: fold mountains and salt domes. ⛰🧂: go.nasa.gov/3XBqXv8
#NASAEarth
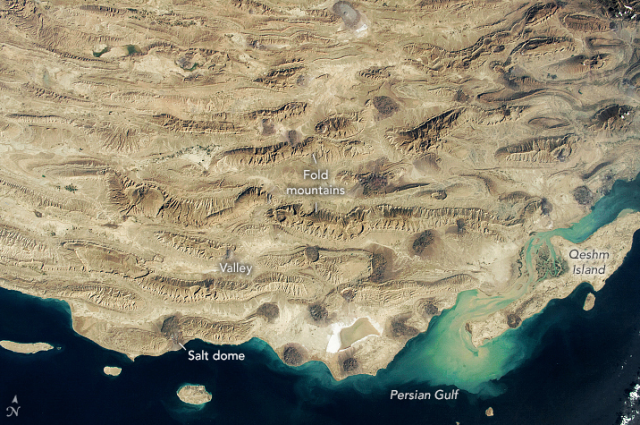
Ridges and Valleys of the Zagros Mountains
This astronaut photograph illustrates the undulating geology of a segment of the mountain range in southern Iran.go.nasa.gov
🧑🚀: go.nasa.gov/3krySwP
#NASAEarth
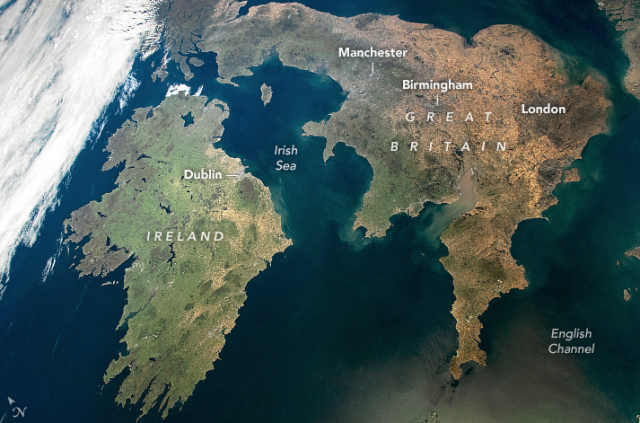
Great Britain and Ireland Show Their Colors
Mountains, vegetation, and urban centers contribute to the islands’ colorful palette.go.nasa.gov
#NASAEarth


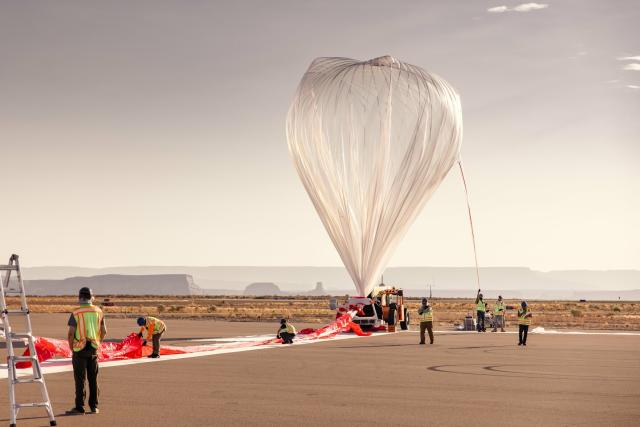
NASA Awards Students Flight Opportunity in TechRise Challenge
NASA selected 60 winning teams for the second TechRise Student Challenge, a nationwide contest designed to engage students in technology, science, and space exploration.Roxana Bardan (NASA)
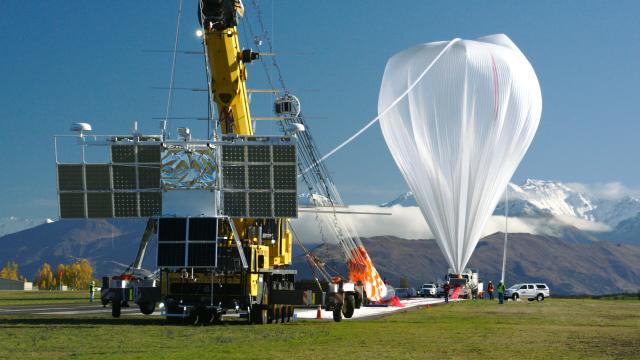
Creeping, rising, falling, slipping – some parts of Earth are always moving. Using advanced tools and creative data analyses, @nasa scientists are monitoring Earth’s movements, which are usually too tiny for us to notice.
A few things we’ve learned: go.nasa.gov/3XpYrgw
#NASAEarth
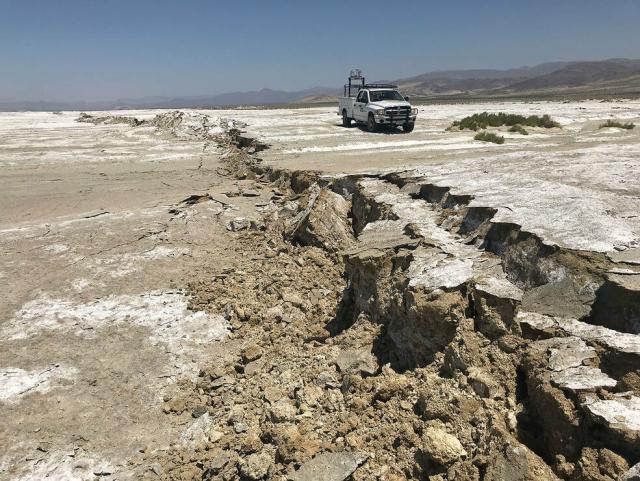
NASA Scientists and Satellites Make Sense of Earth’s Subtle Motions
What can hidden motions underground tell us about earthquakes, eruptions, and even climate change? NASA scientists are using data gathered 400 miles above Earth to find out.Tony Greicius (NASA)
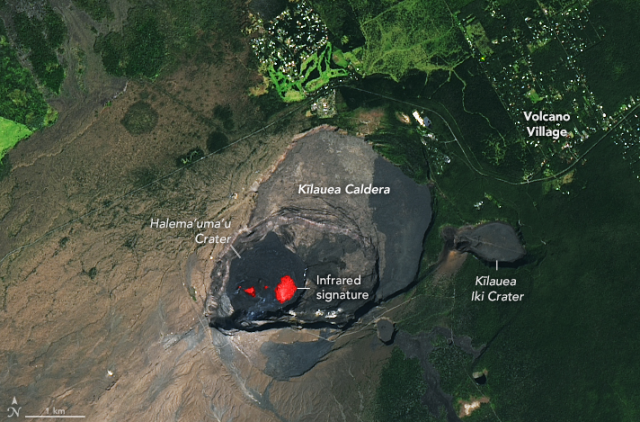
The Kilauea volcano in Hawaii began erupting on Jan. 5, 2023 according to @usgs.
This image made from #Landsat 8 data shows a satellite view of the volcano from Jan. 11 overlaid with the infrared signature (in red) from the lava’s heat.
🌋: go.nasa.gov/3IRSVhZ
#NASAEarth