Search
Items tagged with: nasaearth
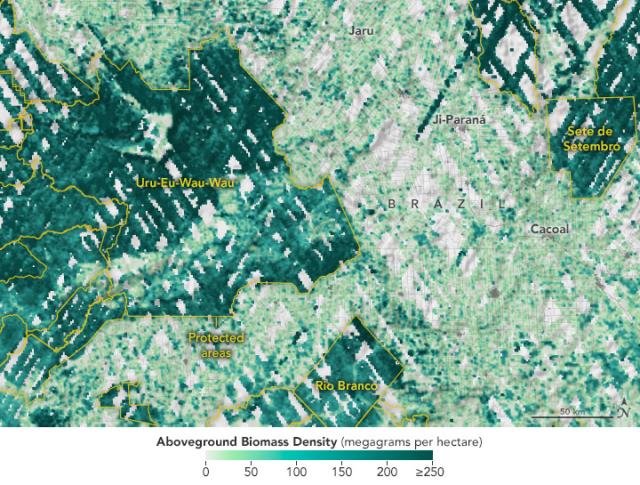
This map shows GEDI biomass density data in Rondônia in western Brazil overlaid with the boundaries (in yellow) of protected areas like the Uru-Eu-Wau-Wau indigenous territory.
Biomass is much denser (dark green) within the protected area. More: go.nasa.gov/3ptW5RU
#NASAEarth
Protected Areas Safeguard Climate
Protecting carbon stored in ecosystems could be a powerful tool in tackling climate change.go.nasa.gov
Intense rains from Cyclone Biparjoy caused widespread flooding in India. 🌀🌧️
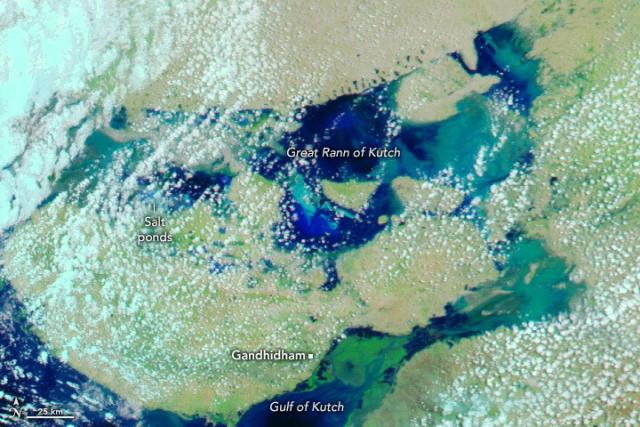
In this enhanced-color image from @nasa’s Aqua satellite taken on June 21 (after the storm), water is dark blue and sediment-rich water is greenish blue. go.nasa.gov/44qMTwx
#NASAEarth
Biparjoy Swamps Western India
Intense rainfall led to flooding in parts of Gujarat, Rajasthan, and Madhya Pradesh as the slow-moving storm moved inland.go.nasa.gov
The India Meteorological Department reported that Cyclone Biparjoy was one of the longest-lived cyclones ever observed in the North Indian Ocean.
It lasted 13 days and three hours, compared to the average of six days and three hours. go.nasa.gov/44qMTwx
#NASAEarth
Biparjoy Swamps Western India
Intense rainfall led to flooding in parts of Gujarat, Rajasthan, and Madhya Pradesh as the slow-moving storm moved inland.go.nasa.gov
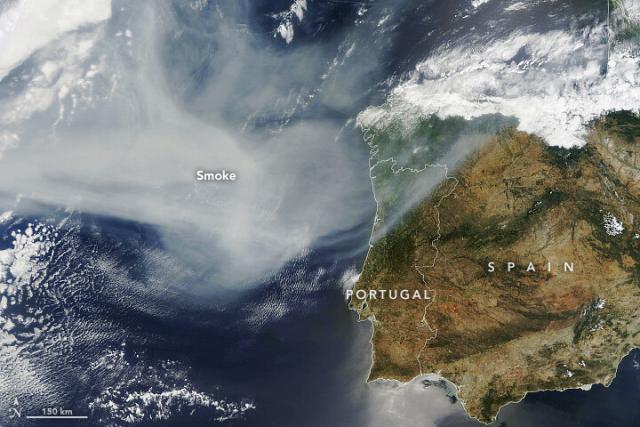
Smoke from wildland fires in Canada has now reached Europe.
@nasa’s Terra satellite captured this image of smoke drifting across the Atlantic Ocean and over Portugal and Spain on June 26, 2023. go.nasa.gov/3r0DoWl
#NASAEarth
Canadian Smoke Reaches Europe
Smoke from wildland fires in Canada traversed the Atlantic Ocean and drifted over European countries including Portugal and Spain.go.nasa.gov
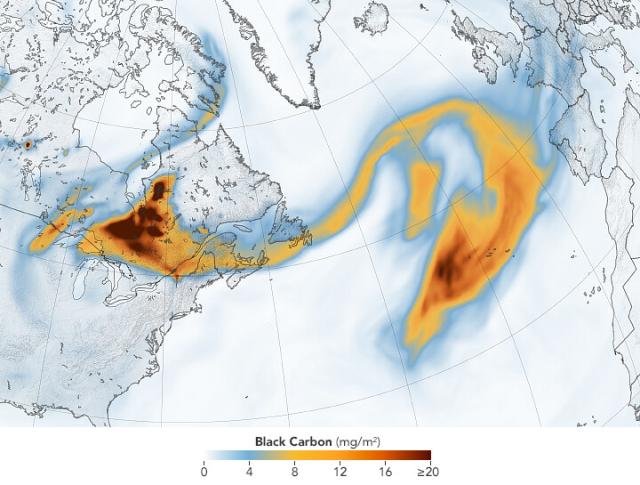
This map shows the density of black carbon particles – or soot – from North America across over 2,000 miles of the Atlantic Ocean.
The data come from @NASAGoddard’s GEOS-FP model that combines satellite, aircraft, and ground-based meteorological data. go.nasa.gov/3r0DoWl
#NASAEarth
Canadian Smoke Reaches Europe
Smoke from wildland fires in Canada traversed the Atlantic Ocean and drifted over European countries including Portugal and Spain.go.nasa.gov
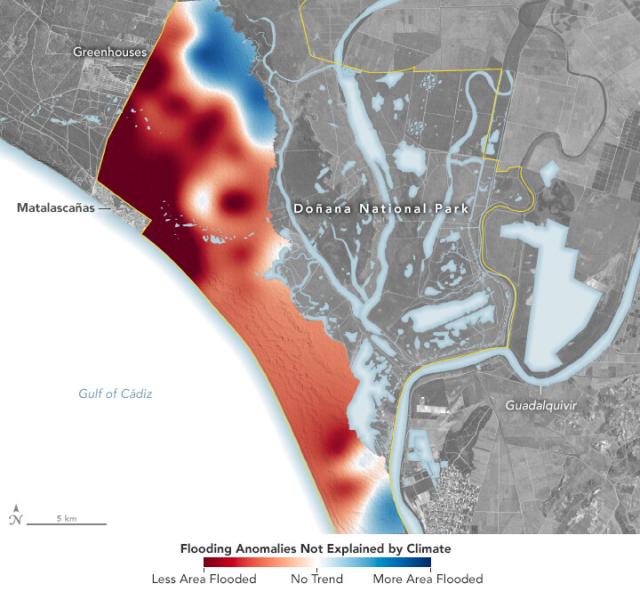
Wetlands in Spain’s Doñana National Park are drying up due to groundwater demands from agriculture, tourism and drought.
Scientists report that 83% of the wetland’s ponds are flooding less extensively and for less time than would be explained by climate. go.nasa.gov/3Xqo01y
#NASAEarth
Water Woes in Doñana National Park
Satellite data show wetlands in Spain desiccated by demands on groundwater and persistent drought.go.nasa.gov
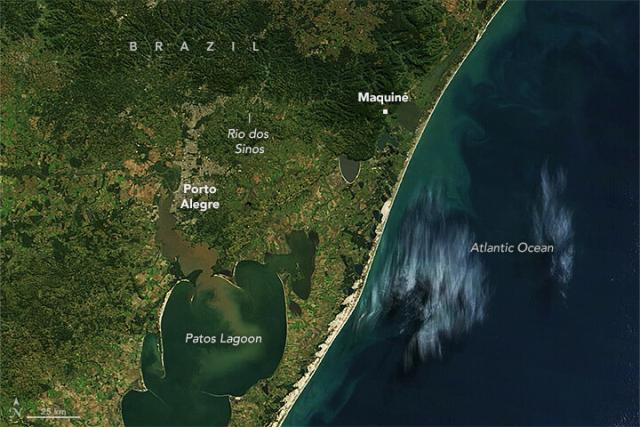
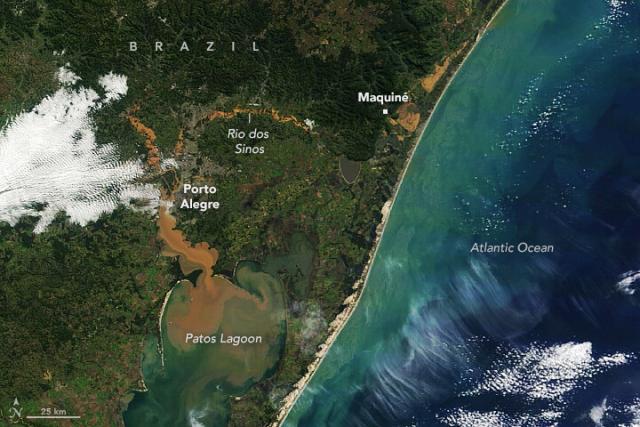
An extratropical cyclone in June 2023 brought torrential rain to southern Brazil, causing deadly flooding.
These @nasa satellite images show the area near the state’s capital, Porto Alegre, before (left) and after (right). go.nasa.gov/3CLbRuP
#NASAEarth
Flooding in Porto Alegre, Brazil
An extratropical cyclone triggered deadly flooding in the state of Rio Grande do Sul.go.nasa.gov
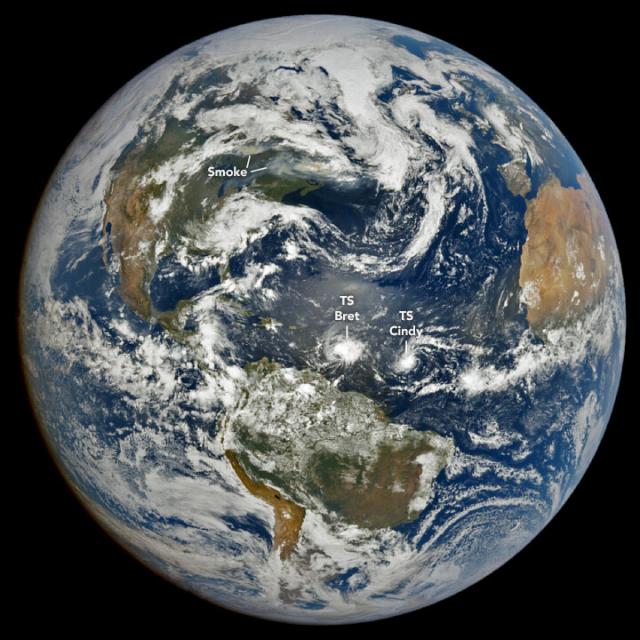
Look at that EPIC view! 🌀🌀
NASA’s Earth Polychromatic Imaging Camera (EPIC) on @NOAA’s DSCOVR satellite captured this view of two tropical storms, Bret and Cindy, on June 22, 2023. go.nasa.gov/441E4tk
#NASAEarth
String of Storms in the Atlantic
In a first for the month of June, two named storms developed over the tropical Atlantic Ocean east of the Caribbean Sea.go.nasa.gov
In the Himalayas, students with the @GLOBEProgram are learning about the most essential resource to life on Earth: water. 💧
They’re measuring water quality, identifying cloud types, mapping mosquito habitats, and learning how to share that data as @nasa #CitizenScientists.
#NASAEarth
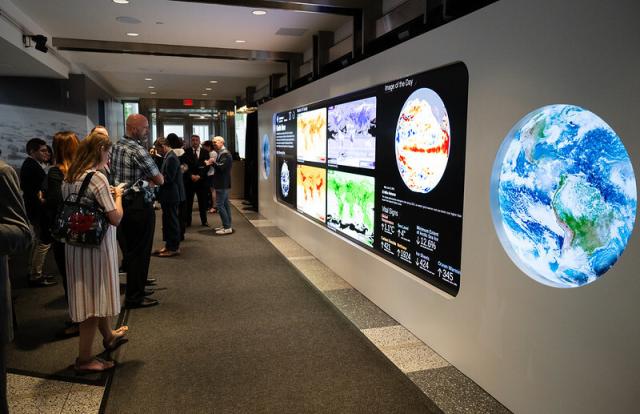
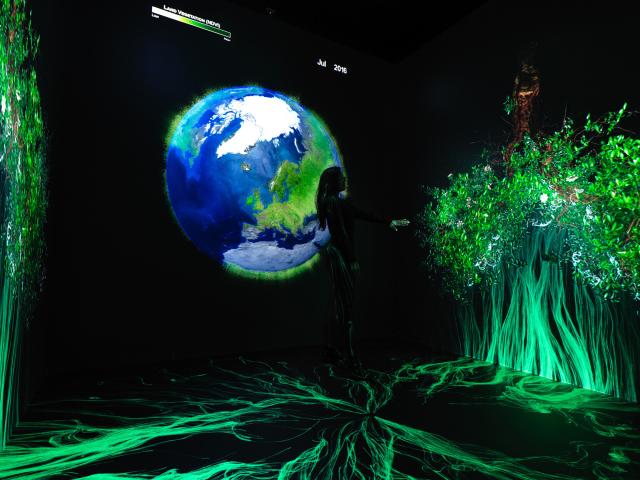
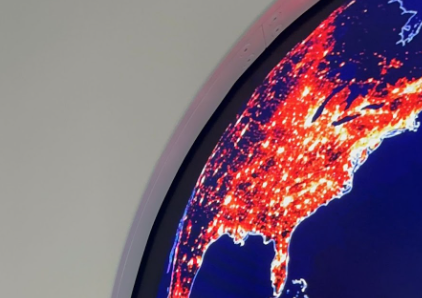
NASA’s Earth Information Center is now open to the public! 🚨🌎
Visit @nasa in downtown Washington, D.C. to see what we’re learning about our home planet in our new Earth science exhibit and immersive experience. go.nasa.gov/eic
#NASAEarth
Can’t visit @nasa’s Earth Information Center in person?
Explore the virtual exhibit online from wherever you are! 💻 go.nasa.gov/eic
#NASAEarth
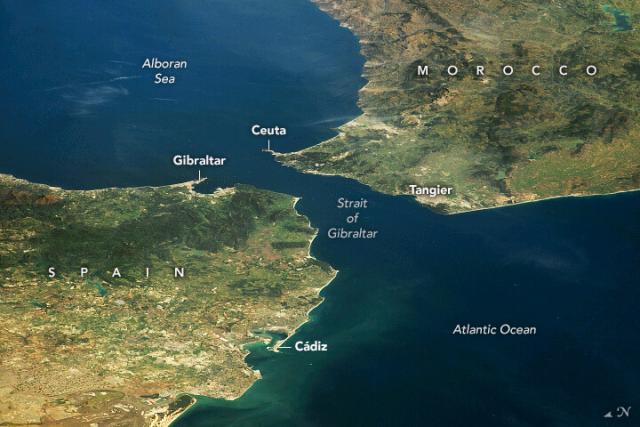
A @Space_Station astronaut took this photo of the Strait of Gibraltar between Spain and Morocco in April 2023. go.nasa.gov/44gbqo2
The channel connects the Atlantic Ocean and Mediterranean Sea and spans only 13 kilometers (8 miles) at its narrowest point.
#NASAEarth
The Strait of Gibraltar
At the strait’s narrowest point, only 13 kilometers separate Europe and Africa.go.nasa.gov
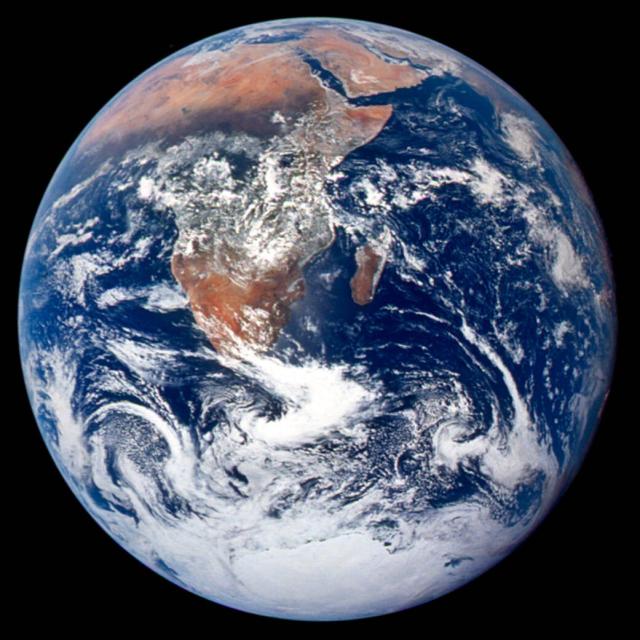
Home sweet home 🌎 😍
Earth inspires us from every angle. NASA’s missions from ground to space help us discover more about our home planet, how it’s changing, and how we can prepare for the future. nasa.gov/Earth
#NASAEarth
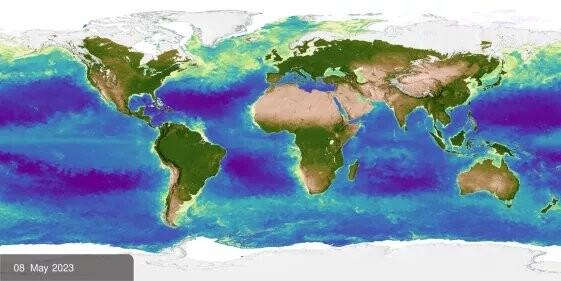
NASA wants to identify species of phytoplankton, tiny plant-like ocean organisms, from space. Why?
They produce oxygen, soak up carbon, are food for fish, can cause harmful algal blooms, and more. go.nasa.gov/3Pp2W9T 🌊
#NASAEarth
NASA Wants to Identify Phytoplankton Species from Space. Here’s Why.
They’re small, but they’re mighty. From producing oxygen we breathe to soaking up carbon we emit to feeding fish we eat, tiny phytoplankton are a crucial part of ocean ecosystems and essential to life as we know it on Earth.Kate Ramsayer (NASA)
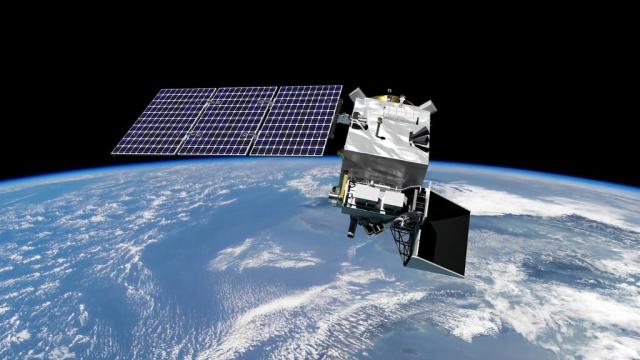
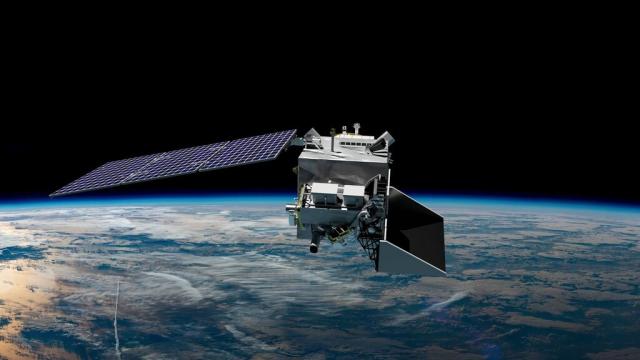
In early 2024, @nasa is launching the PACE satellite, which will see the ocean in more colors than ever before.
PACE is also hyperspectral and will be able to identify phytoplankton by species for the first time from space. go.nasa.gov/3JtCw2Y
#NASAEarth
NASA PACE - Home
PACE's technologies will provide unprecedented insight into Earth's ocean and atmosphere, which impact life by regulating climate and making Earth habitablego.nasa.gov
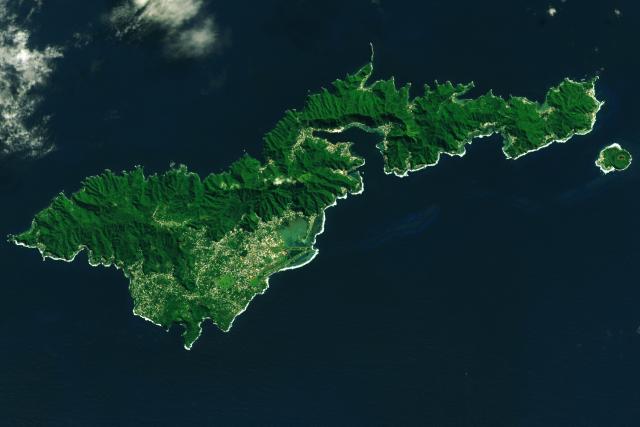
NASA scientists are mapping ground changes on earthquake-prone islands like Tutuila, the largest American Samoa island, in this #Landsat 8 image.🏝️
They found that Tutuila sank an average 6-9 mm per year from 2015-2022, compared to 1-2 mm before 2009. go.nasa.gov/3r1XRKg
#NASAEarth
Tutuila Island, American Samoa
Volcanoes, rainforests, and reefs abound in this tropical U.S. territory.go.nasa.gov
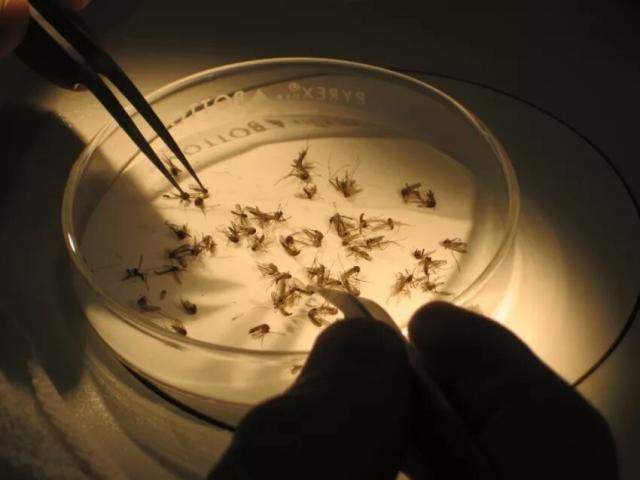
Wait, is that a mosquito?
NASA can’t see mosquitoes from space, but our satellites can monitor the habitats they prefer. 🦟
This #MosquitoWeek, learn how satellite data can help public health experts track these disease-spreading insects. go.nasa.gov/3NGFkMF
#NASAEarth
How NASA Helps Fight Mosquitoes from Space | NASA Applied Sciences
Mosquitoes are sometimes hard to spot, even with the human eye.go.nasa.gov
Have a glorious #Pride!
Glories are an optical phenomenon caused by water droplets scattering sunlight back toward the light source, creating these rainbow-like colors. 🌈 go.nasa.gov/3XjT03n
@nasa’s Terra satellite captured this glory in the Caribbean in 2018.
#NASAEarth
A Slice of Glory
People have been marveling at glories for centuries, but satellites offer a unique perspective on the colorful optical phenomenon.go.nasa.gov
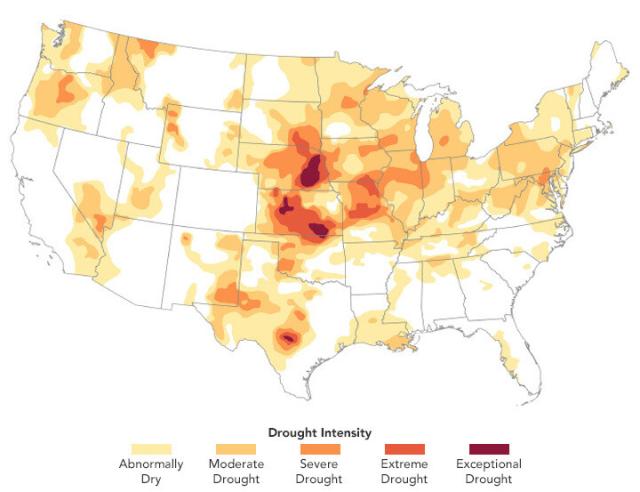
Kansas normally produces about 25% of winter wheat in the U.S. winter wheat crop, but that may not happen this year due to prolonged drought.
This U.S. Drought Monitor map shows drought intensity as of June 20, 2023, with 79% of Kansas in a drought. go.nasa.gov/3r3ro6h
#NASAEarth
A Rough Harvest for Kansas Wheat
Prolonged drought in Kansas set the stage for what may be one of the state’s smallest wheat harvests in decades.go.nasa.gov
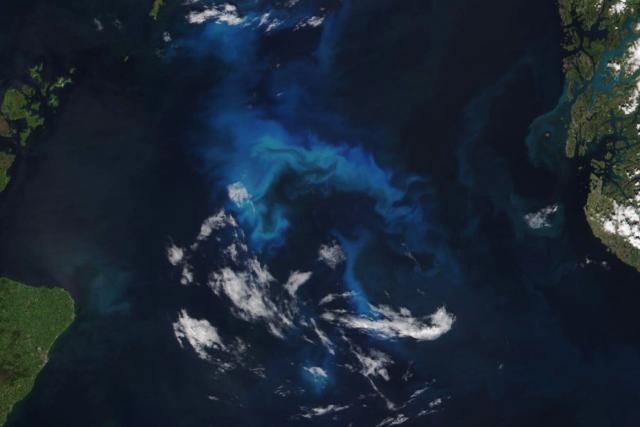
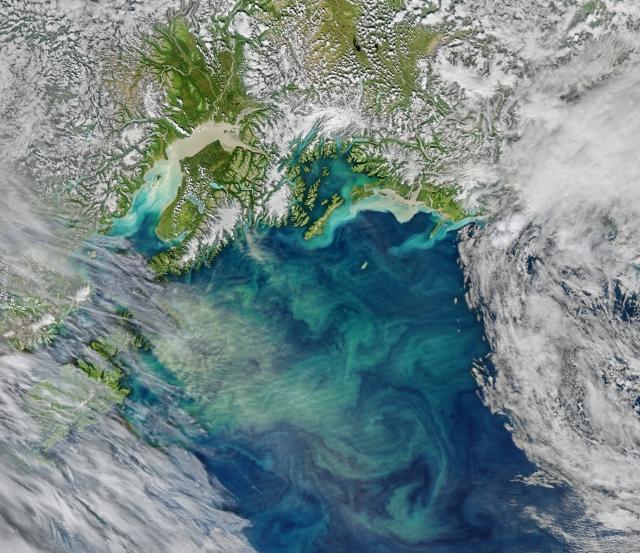
Phytoplankton blooms in the North Sea are starting later in the year and lasting slightly longer, according to research from Norwegian scientists using data from multiple @nasa and NOAA satellite sensors.
More: go.nasa.gov/43Tor76
🛰️ : @noaa-20 on June 15, 2023
#NASAEarth
Phytoplankton Flourish in the North Sea
Turquoise swirls of phytoplankton developed over the course of two weeks in the shallow sea basin.go.nasa.gov
Noctiluca, is that you?
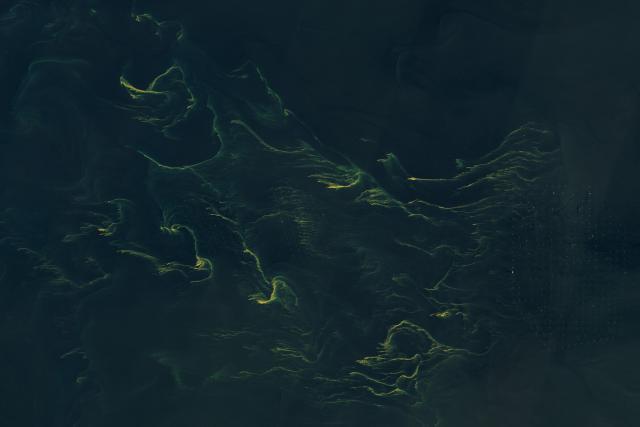
The @nasa / @usgs #Landsat 9 satellite captured this image of swirling tendrils of phytoplankton – which appear to be Noctiluca scintillans – off the coast of Germany's East Frisia Islands on June 14, 2023. #WorldOceansMonth
🌊 : go.nasa.gov/3JryeZU
#NASAEarth
Noctiluca in the North Sea?
These swirling tendrils of phytoplankton might be Noctiluca scintillans—a type of marine dinoflagellate known to inhabit this area.go.nasa.gov
NASA’s upcoming PACE satellite will allow researchers to infer more information about the oceans.
PACE will be able to determine the concentration and size of particles in seawater, diversity of phytoplankton, and rates of phytoplankton growth. go.nasa.gov/3Jryg3Y
#NASAEarth
NASA PACE - Home
PACE's technologies will provide unprecedented insight into Earth's ocean and atmosphere, which impact life by regulating climate and making Earth habitablego.nasa.gov
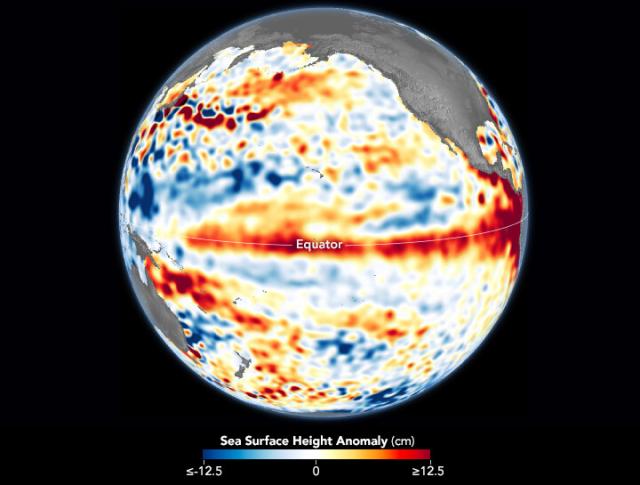
El Niño is back. 🌊
On June 8, 2023 @noaa declared El Niño conditions – known for warmer than average sea surface temperatures in the tropical Pacific that can bring cooler, wetter conditions to the U.S. Southwest and drought to the western Pacific. go.nasa.gov/3JokwXH
#NASAEarth
El Niño Returns
The climate phenomenon emerged in late spring 2023, as waters grew warmer and sea levels rose higher than usual in the tropical Pacific Ocean.go.nasa.gov
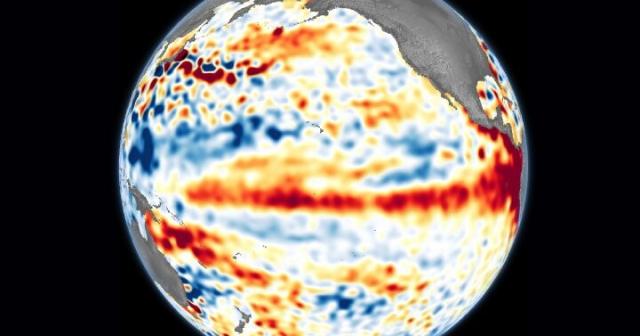
El Niño can be seen in sea surface height, as warmer waters pile up due to weakening trade winds, raising sea level.
This map shows sea surface height anomalies from the Sentinel-6 Michael Freilich and Sentinel-3B satellites for June 1-10, 2023. go.nasa.gov/3JokwXH
#NASAEarth
El Niño Returns
The climate phenomenon emerged in late spring 2023, as waters grew warmer and sea levels rose higher than usual in the tropical Pacific Ocean.go.nasa.gov
Today NASA Administrator @SenBillNelson cut the ribbon to unveil @nasa’s new Earth Information Center in downtown D.C.!
The exhibit and immersive experience will open to the public on June 26. Info: go.nasa.gov/3Jpr4Fu
#NASAEarth
NASA Holds Ribbon Cutting for New Earth Information Center
NASA Administrator Bill Nelson led a ribbon cutting ceremony Wednesday to showcase a new Earth Information Center at NASA Headquarters in Washington.Claire O’Shea (NASA)
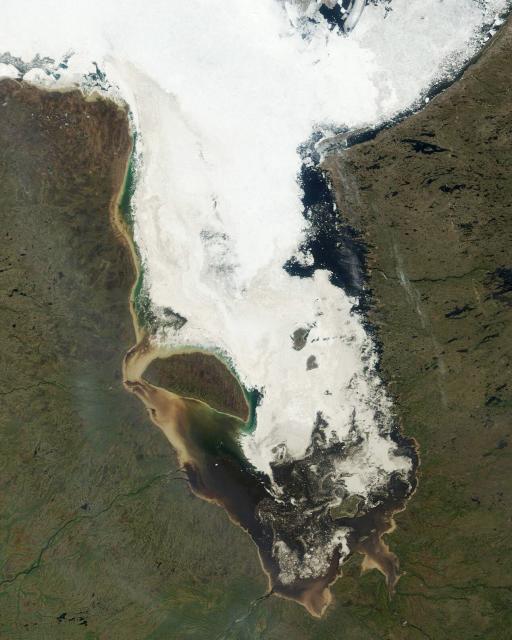
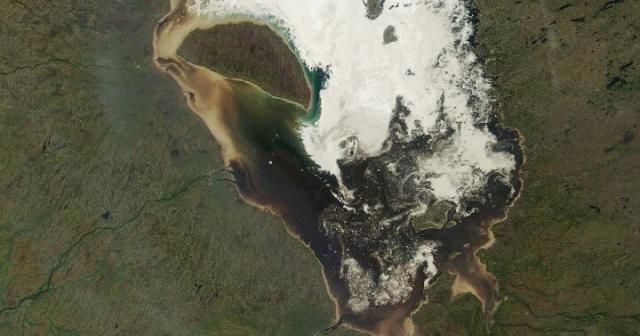
Seasonal sea ice is breaking up in Canada’s James Bay. 🧊
@nasa’s Terra satellite captured this image on June 2, 2023, when little fast ice (ice fastened to the surrounding coastlines) remained. Typically, fast ice grows in December and breaks up in May. go.nasa.gov/3CDnT9l
#NASAEarth
Notice the stain?
Much of the ice is stained with sediment, which Canadian scientists say is typical and may be caused by tides stirring up sediment that gets into the ice and concentrates on the surface as the ice melts. go.nasa.gov/3CDnT9l
#NASAEarth
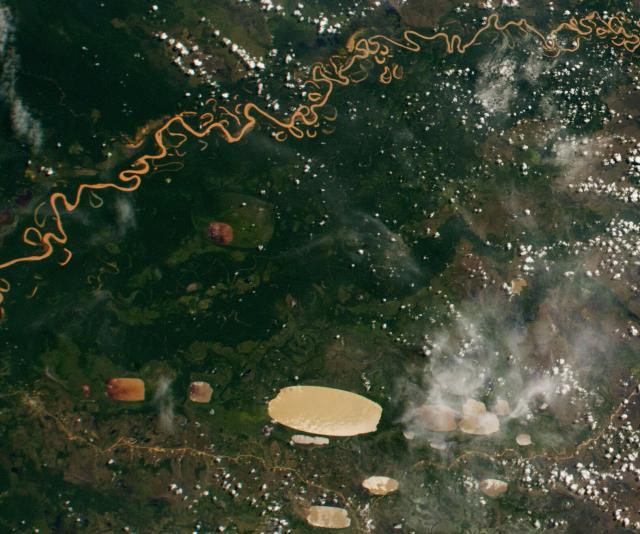
Lakes come in all shapes and sizes! 🟦
A @Space_Station astronaut took this image of “oriented lakes” in the Bolivian lowlands. The rectangular-shaped lakes are only a few meters deep and oriented in the same direction. go.nasa.gov/3Jkxztg
#NASAEarth
The Bolivian Lowlands
The ecoregion displays an array of natural patterns, from meandering rivers to rectangle-shaped lakes.go.nasa.gov
Scientists studied how ocean heatwaves affected phytoplankton in the open Pacific Ocean using satellite data, models and @NASA_NCCS supercomputers. 🌊 #WorldOceanMonth
Full story: go.nasa.gov/3PcyWOl
#NASAEarth
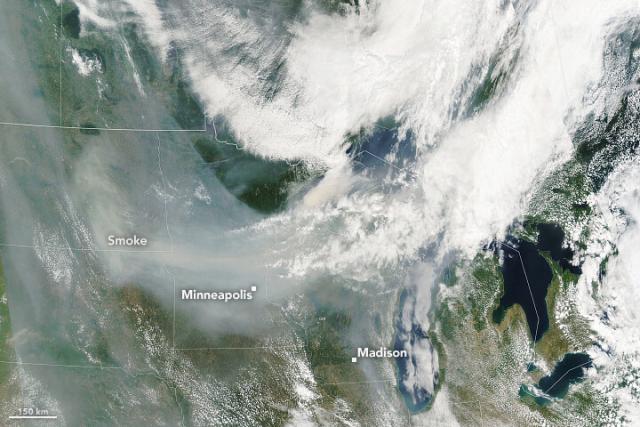
Smoke from fires in Canada is shrouding the U.S. Midwest, causing hazy skies and hazardous air quality in Canada and across several U.S. states.
@nasa’s Aqua satellite captured this image on June 14, 2023.
go.nasa.gov/3NyMP8c
#NASAEarth
Smoke Blankets the Upper Midwest
Smoke from the fires in Canada polluted the air and shrouded the Minneapolis skyline.go.nasa.gov
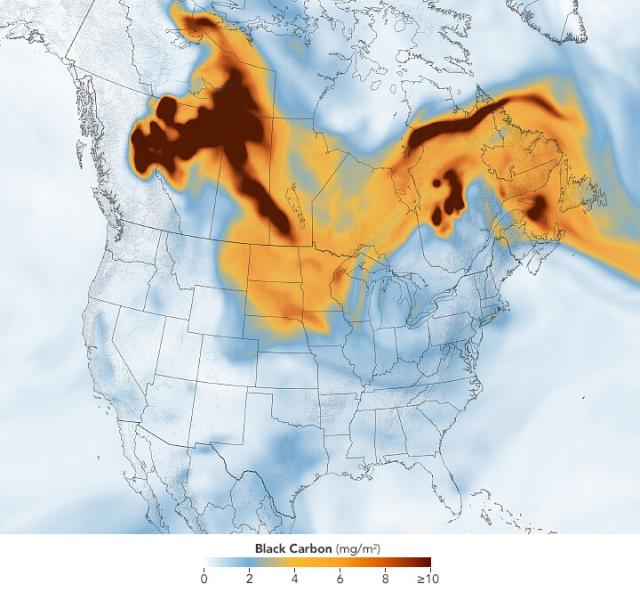
This map shows the density of black carbon particles—or soot—in the smoke, which can be hazardous for human health.
The data come from @nasagoddard’s GEOS-FP model.
#NASAEarth
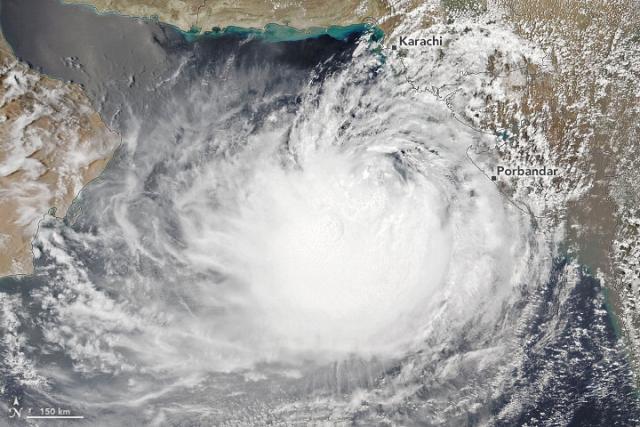
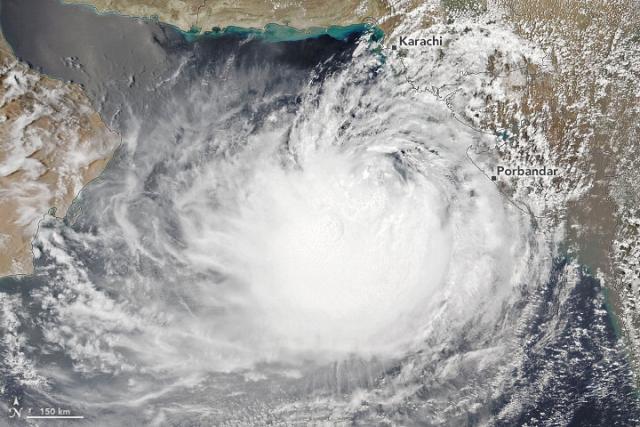
Cyclone Biparjoy is nearing western India and southern Pakistan after stirring in the Arabian Sea for over a week. Warm sea surface temperatures contributed to the cyclone’s unusually long lifespan.
@NOAA-20 captured this image on June 14. go.nasa.gov/46hZiVk
#NASAEarth
Cyclone Biparjoy Churns Toward India and Pakistan
The long-lived cyclone is expected to make landfall near the border of India and Pakistan.go.nasa.gov
Get those sunglasses! 😎
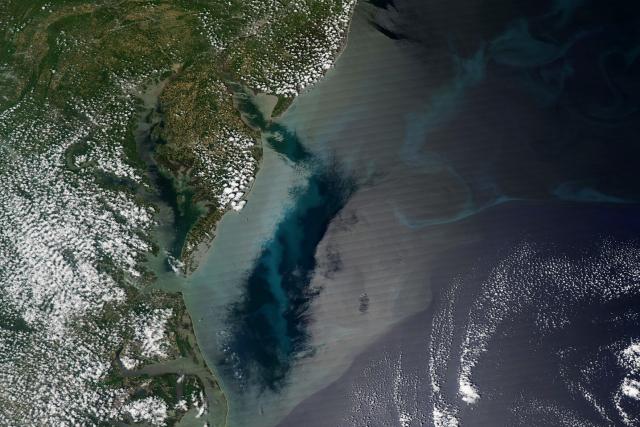
The bright, silvery water in this @nasa Aqua satellite image is due to sunglint. Sunglint happens when sunlight reflects off water at the same angle the satellite sensor views it. go.nasa.gov/3P9gZ3f
#NASAEarth
The Subtleties of Sunglint
Calm waters off the Delmarva Peninsula appear as dark patches within gleaming areas of sunglint.go.nasa.gov
#NASAEarth
New Consortium to Create Innovative Methods to Value Earth Observations | NASA Applied Sciences
From a farmer deciding when to water their crops, to emergency response agencies sending resources after a natural disaster, NASA Earth observations help decgo.nasa.gov
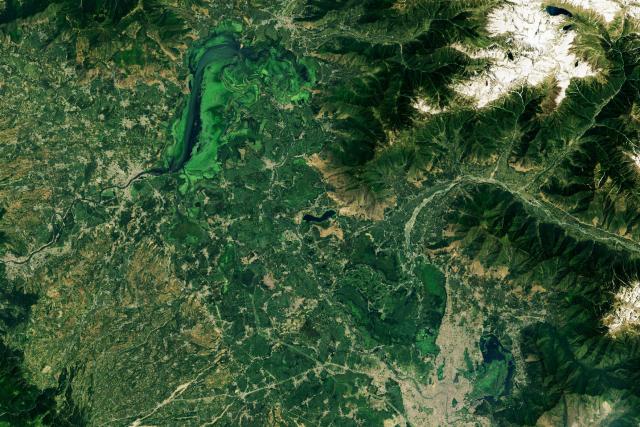
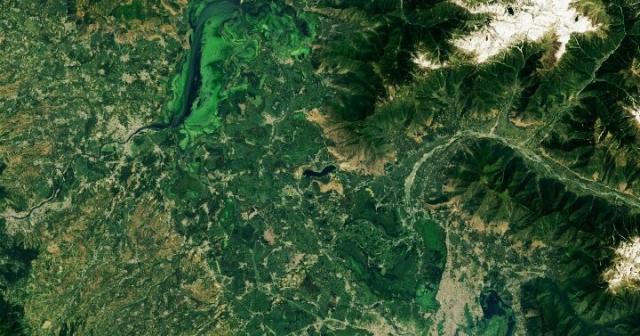
Look closely. 🧐 Can you tell what’s land and what’s water?
Lakes Wular and Dal, surrounded by the high Himalaya Mountains, supply water for drinking and irrigation in northern India, but the lakes have been declining in recent years.
#NASAEarth
#NASAEarth
Shrinking Lakes of the Kashmir Valley
Two of the largest lakes in India’s Jammu and Kashmir region have declined in recent years, with implications for water security.go.nasa.gov
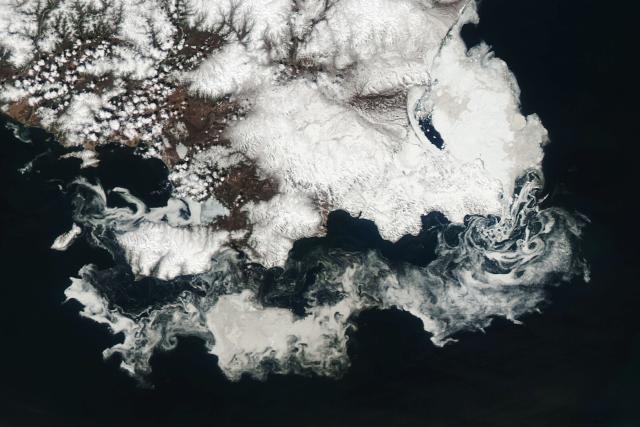
Go off 👏 🧊
Annual thinning and breaking up of sea ice in the Sea of Okhotsk near Russia created beautiful swirls as the ice drifted with the ocean currents and wind. go.nasa.gov/3P82Lj6
#NASAEarth
Ice Swirls in the Sea of Okhotsk
Ice breaking up off the Russian coast whirled at the whims of winds and currents.go.nasa.gov
